Tech
How We Handle Data from 150,000 Power Plants
December 10, 2025

Architecting a System to Manage 150,000 Power Plants #2
– How 60Hertz Achieved Massive Scale Through PVlib Vectorization and Data Structure Simplification –
📂 Introduction | 150,000 Power Plants, One Calculation
60Hertz collects data from more than 150,000 small and mid-sized renewable energy power plants nationwide and operates a system that forecasts their generation output in real time. To maintain grid stability, these forecast values must be calculated both quickly and accurately.
Most people associate “generation forecasting” with machine learning model accuracy. But when the number of forecasting targets reaches 150,000, the question becomes not only how accurate the model is, but also how to complete the computation on time. No matter how good a model is, if the system cannot return results on time due to scale, it is not practical. In this regard, our previous system (v1) required more than an hour to complete a single daily forecasting calculation. The breakthrough came from the following philosophy:
💡 What matters more than code-level parallelization is designing data in a structure simple enough to compute at once.
Unlike v1, the improved system (v2) vectorizes the data and simplifies its structure, completing the same task in just 3–5 minutes. This post explains how 60Hertz achieved this result from a data engineering perspective.
📂 Problem Definition | 150,000 Loops, 150,000 Bottlenecks
In v1, the pipeline was built on Apache Airflow. Airflow is a workflow management platform that schedules and monitors complex data pipelines, and we used it to divide the forecasting tasks for 150,000 power plants into multiple tasks.
Each task combined metadata and weather data for each plant and repeatedly invoked PVlib’s Python-based solar simulation library, specifically the ModelChain API. ModelChain is a high-level API that encapsulates the physical modeling of PV systems (modules, inverters, etc.) and weather-based calculations for a single plant. The high-level workflow can be visualized as follows:
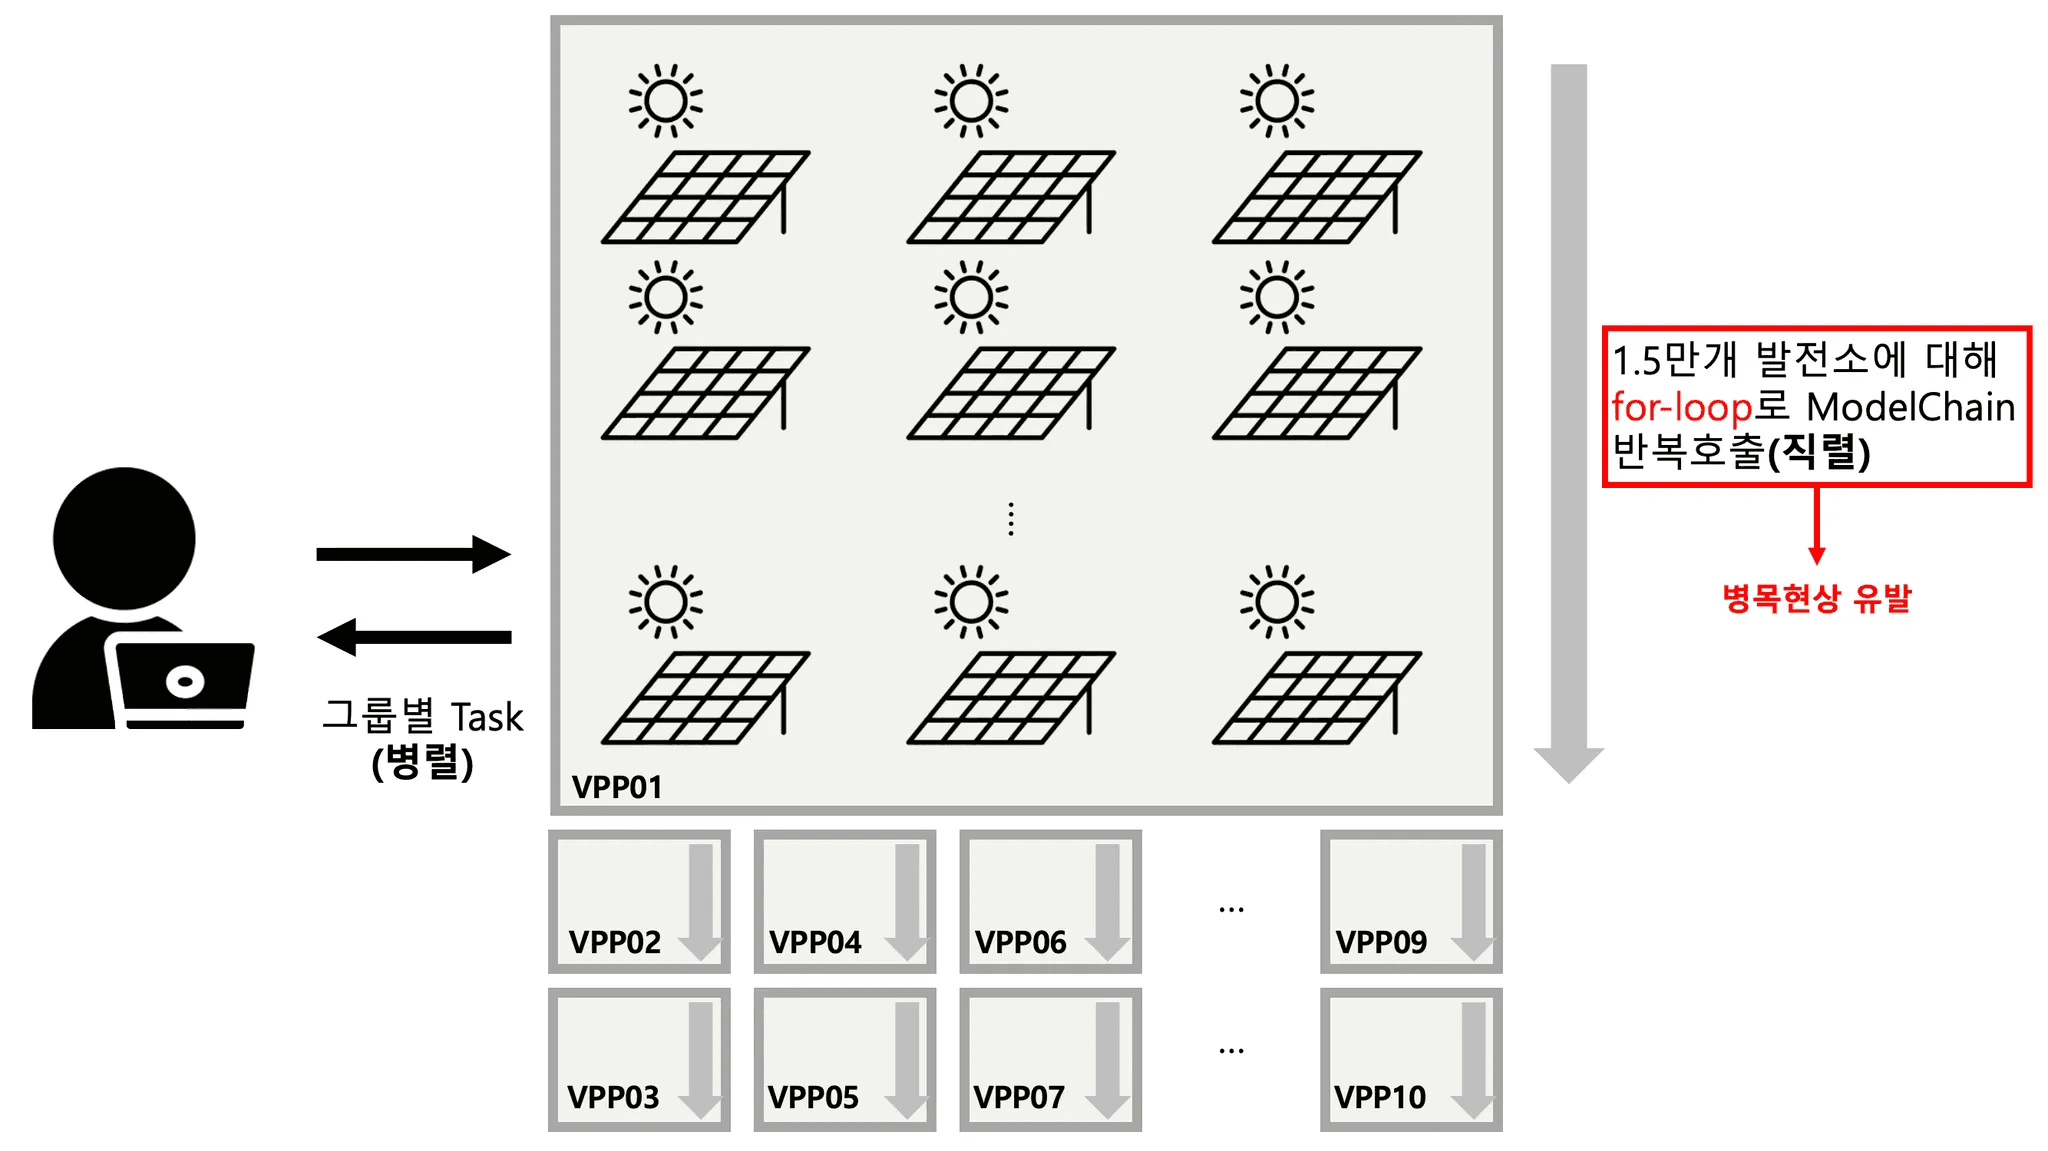
We grouped the 150,000 plants into ten groups, allowing tasks to run in parallel. Within each group, however, 15,000 plants were processed sequentially via a for-loop, repeatedly calling ModelChain. In other words, despite the appearance of parallelization, the overall runtime was dominated by the repeated loops. The bottlenecks in this architecture can be summarized as:
Bottlenecks in computation
Bottlenecks in data structure
Bottlenecks in data I/O
Let’s explore each of these issues and how we resolved them.
a. Computational Bottleneck: Replacing the High-Level ModelChain API
PVlib offers both a high-level API (ModelChain) and low-level APIs, summarized below:
High-level API | Low-level API | |
|---|---|---|
Applied in | v1 | v2 |
Description | Encapsulates all detailed steps required to simulate a PV system for easy modeling | Provides granular functions for each simulation step, allowing flexible and scalable pipelines |
Best for | Single-plant simulation | Large-scale simulation |
Major modules | ModelChain | pvlib.irradiance, pvlib.pvsystem, pvlib.atmosphere |
Pros | Easy to use, quick for single simulations | Fine-grained control; enables vectorized operations |
Cons | Hidden internals, limited control, overhead from repeated object instantiation | Requires deeper understanding; larger initial learning curve |
ModelChain is ideal for simulating a single plant, but not 150,000. It requires creating 150,000 individual ModelChain objects, causing enormous overhead. The high-level code relies heavily on Python for-loops, as shown below.
By contrast, the low-level API consists of pure mathematical functions operating on arrays, enabling massive vectorization. In the low-level implementation, the Python for-loop disappears entirely. Since Python for-loops cannot leverage vectorization, they are inherently slow. By vectorizing the 144 million operations (150k plants × 96 time steps), we allow C-level vectorized operations to run efficiently.
b. Data Bottleneck: Accelerating Processing Through Vectorization
Pandas and NumPy rely on C-level vectorized operations; groupby operations also benefit from these optimizations. But in v1, plants were grouped using agg(list), converting values into lists and breaking the contiguous memory layout required for NumPy arrays. As a result, values fell back to the object dtype, eliminating vectorization benefits entirely.
When data is vectorized, performance improves drastically due to:
SIMD (Single Instruction, Multiple Data)
The CPU processes many values with a single instruction when data types are uniform.Elimination of repeated type dispatching
Python must check types for every iteration of a loop. NumPy arrays check once at creation, then execute pure C-level instructions with near-zero overhead.Contiguous memory layout
This increases CPU cache hits and reduces pointer dereferencing, boosting performance.
In contrast, object-type arrays store pointers instead of actual values. Actual data may be scattered in memory, and types may differ, forcing Python-level interpretation and making vectorization impossible.
The key lesson from v1 was simple:
C-level operations are only possible when values of the same data type are stored in a contiguous block of memory. For example, an array of int64 values is laid out as tightly packed raw numbers; once the CPU knows the address of the first value, it can execute a single instruction such as “add these next 1,000 values” in one go.
In contrast, an array of object dtype stores pointers, not actual values. The real data may be scattered across memory, and each element may even have a different type. In this case, C-level operations are no longer feasible, forcing the much slower Python interpreter to step in and handle each element one by one. This results in an inherently inefficient execution path.
Do not compensate for a poor data structure with complex parallelism. Design simpler data.
This led to v2’s core principles:
Remove loops: eliminate Python for-loops
Vectorize: leverage NumPy broadcasting
Simplify structure: use a flat 2D long-form structure instead of nested lists
Whereas v1 processed “150,000 plant objects,” v2 handles “arrays of tilt, azimuth and other attributes stored contiguously.” The shift to a data-centric architecture fundamentally changed the codebase.
c. Data I/O Bottleneck: The Only Thing Slower Than the CPU Was the Data
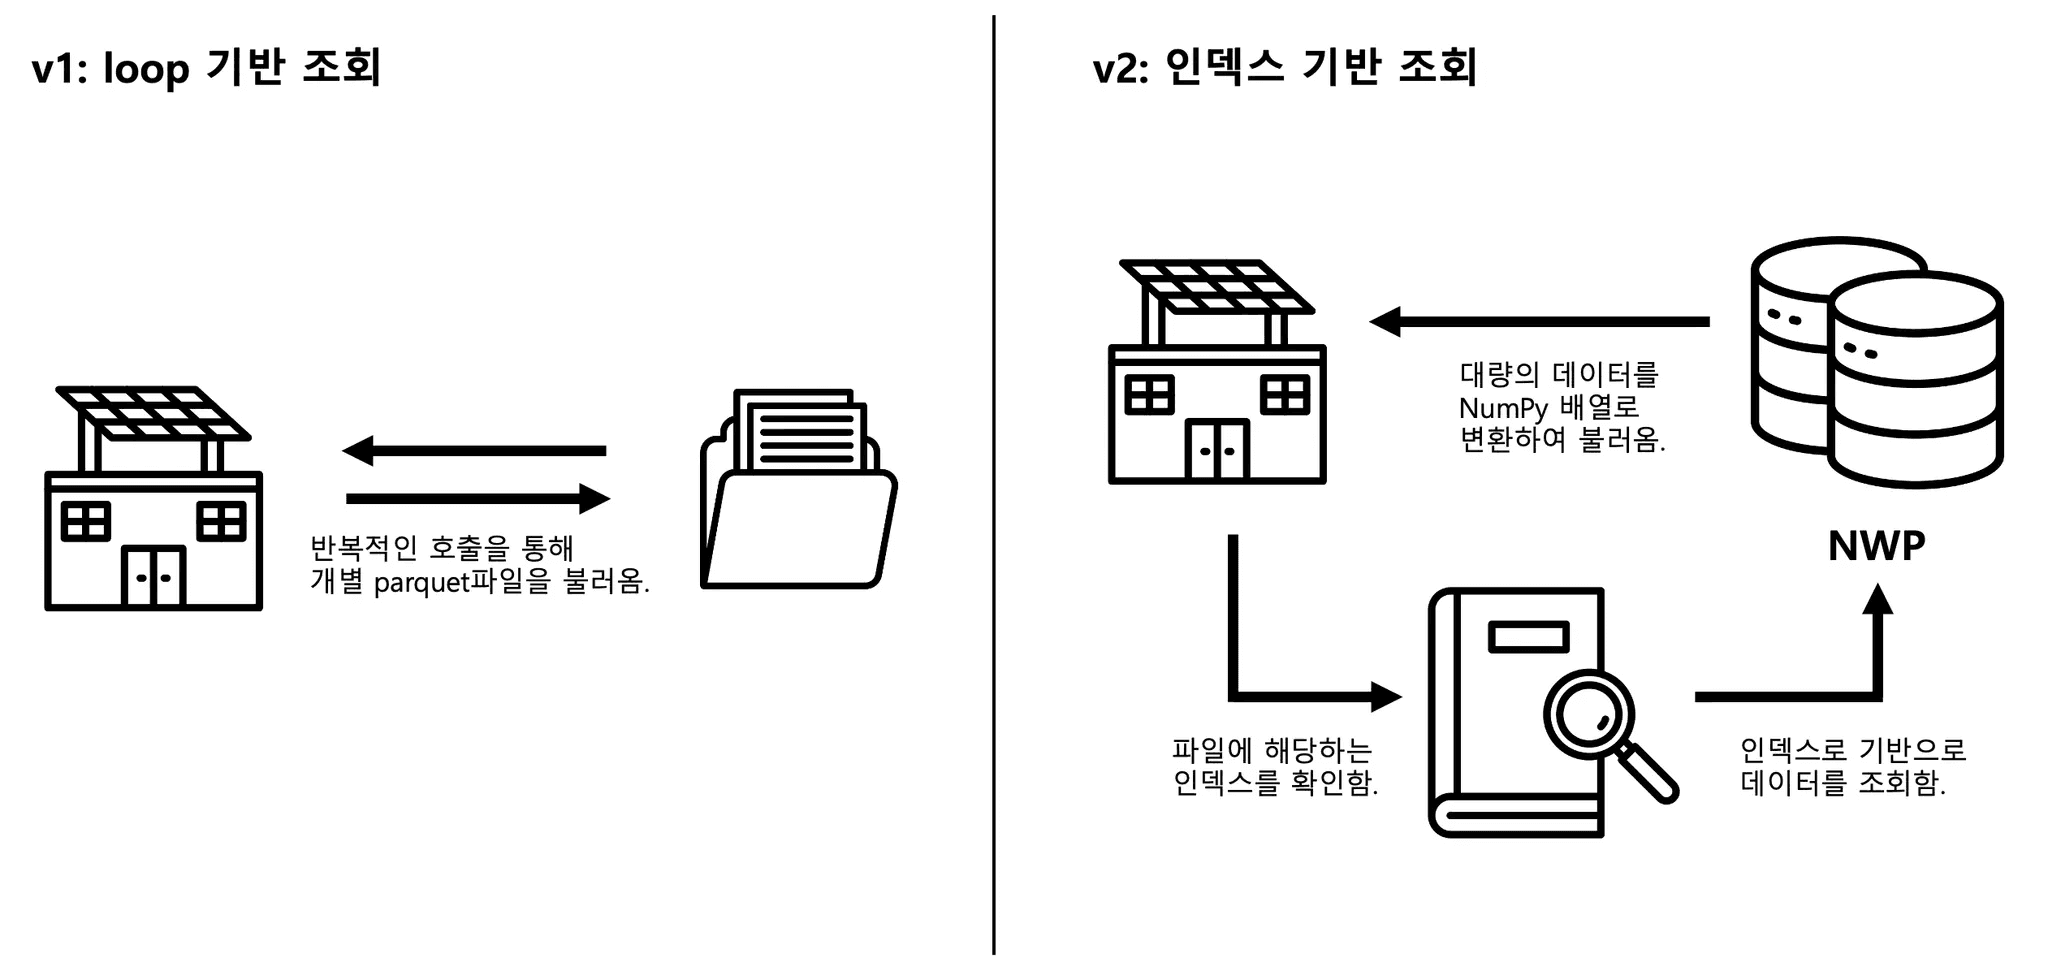
Even with the low-level API, I/O remained a major slowdown. In v1, each plant repeatedly loaded its weather forecast data (NWP) from individual Parquet files—15,000 file reads per task. Even with parallel tasks, this created massive I/O bottlenecks, like sending 15,000 packages through a single motorcycle courier.
v2 solved this through:
Index-based batch retrieval
Bulk data transmission (e.g., fetch_df_all() )
All NWP data were stored in Oracle DB, and plant locations were used as indices to fetch all required data with a single SQL query per batch, drastically reducing network round-trips.
Furthermore, instead of using Python’s DB-API (execute(), executemany()), we adopted the Apache Arrow–based python-oracledb DataFrame API, which directly materializes large DB results into NumPy arrays. This avoids Python object creation, achieving near-zero-copy efficiency.
📂 The Power of Structure, Proven by Numbers
After resolving the above bottlenecks, v2 improved data loading performance by several orders of magnitude. This contributed directly to overall pipeline acceleration. Comparing v1 and v2:
Category | Approach | Processing Time | Lines of Code |
|---|---|---|---|
v1 | Python for-loops per plant | >1 hour | ~1,200 |
v2 | Vectorized operations and simplified structure | ~3 minutes | ~400 |
With full utilization of 24 CPU cores, v2 completes the forecast in 3 minutes—about a 20× speedup.
Equally important: reducing 1,200 lines of complex, fragmented code to 400 lines of clean vectorized logic.
We achieved both performance and maintainability.
📂 If You Want to Solve Problems Like This…
In real-world systems, it’s not enough to know how a service runs, but how well it runs. As product scope expands, broader engineering insight becomes essential.
At 60Hertz, we look for engineers who:
Understand not just data collection or ML training, but the core nature of the problem
Can determine which structures scale efficiently when handling data at the scale of 150,000+ units
Think deeply about how to minimize unnecessary network round-trips and optimize end-to-end performance
Clearly understand the difference between running many tasks simultaneously and performing large-scale computation in a single vectorized process